Note: This is the full version of an article that we presented in a somewhat shortened form in our January 2020 newsletter.
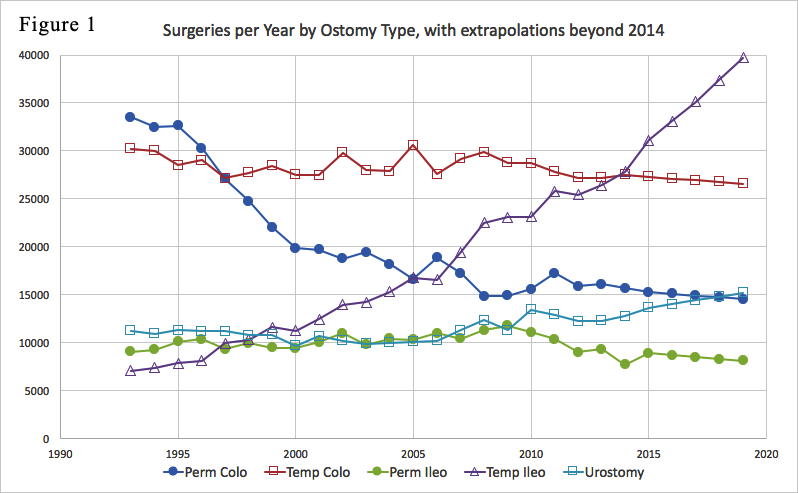
UOAA, as well as its predecessor UOA, have published estimates on the number of people with an ostomy and number of ostomy surgeries per year. For example, from about 2012 to 2016, UOAA produced brochures stating that there were about 750,000 ostomates in the U.S. In 2017, UOAA launched a project intended to update our knowledge of such quantities. I participated in that project and, although the goal was presumably to determine just two numbers (number of ostomates and number of surgeries per year), I ended up deriving many more results of interest including trends over time of various surgery types. Many of those trends are displayed in Figure 1 below:
Major trends in the above plot include a big decrease in permanent colostomy surgeries (which dropped sharply from 1995 to 2000, then continued decreasing more slowly after 2000), and an even more dramatic increase in temporary ileostomy surgeries (which were the least common type of ostomy surgery in 1993 but are the most common type now).
Before continuing my interpretation of this data, I’ll say something on how I obtained it. I derived it using data from HCUP, the “Healthcare Cost and Utilization Project” (see https://hcup-us.ahrq.gov), which is a huge collection of U.S. healthcare data. The particular HCUP database I used was NIS, the “National Inpatient Sample,” which attempts to estimate hospital-related quantities at a national level by sampling about 20% of all discharges from U.S. community hospitals. Also, while some HCUP data is only available for purchase, the information I used is all available publicly on the HCUPnet website at https://hcupnet.ahrq.gov which provides free access to a lot of the HCUP data.
For estimating ostomy surgery numbers from HCUP data, I was careful to select mutually exclusive procedure codes, to avoid multiple counting of individual surgeries. Also, my methodology for distinguishing between temporary and permanent ostomies was designed so my counts of temporary ostomies include only ostomies that were actually reversed, whether or not they were originally intended to be temporary.
The surgery data I obtained from HCUP covers 22 years, from 1993 to 2014 (I’ll say more below on why it isn’t available after 2014). My plot above, as well as additional plots below, show the range from 1993 to 2014 and also display mathematical extrapolations for 5 later years (2015 to 2019). These extrapolations can be considered reasonable estimates for several years after the 2014 data cutoff, although they lose accuracy if projected too far into the future.
Notes on continent diversions:
The two biggest trends in Figure 1 are the big decrease in permanent colostomies and even bigger increase in temporary ileostomies. The drop in permanent colostomies is due to the rise of “sphincter-sparing” colorectal cancer surgeries, which have become possible for tumors located lower and lower in the anorectal area. These remove the cancer while preserving continuity to the anus, and require only a temporary ostomy, usually a temporary ileostomy.
Temporary ileostomy surgeries have increased dramatically. This increase probably has at least three causes:
As additional trends visible in Figure 1, urinary diversions are increasing now, while permanent ileostomies are decreasing, presumably because J-pouches have been replacing permanent ileostomies for ulcerative colitis and familial polyposis.
By adding up the 5 categories in Figure 1, we obtain the total number of ostomy and continent diversion surgeries as follows:
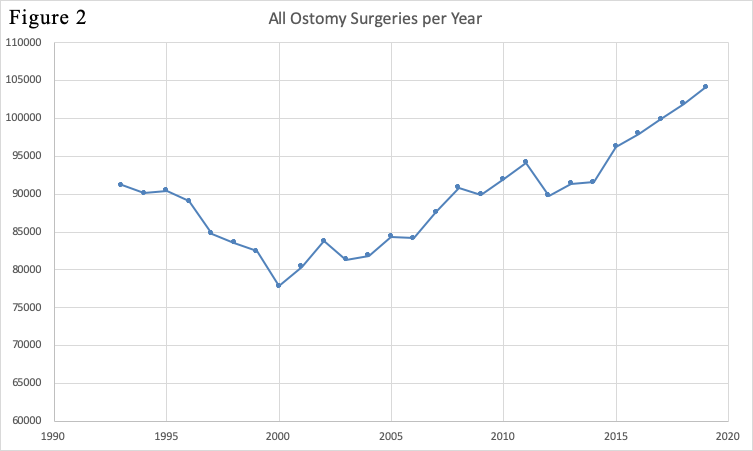
The total was decreasing for some years before 2000, due to the big drop in permanent colostomy surgeries. It’s been increasing since 2000, due to the big increase in temporary ileostomies. The total is currently around 100,000 surgeries per year, although it seems to be increasing about 2% per year, and may currently be about 105,000.
The figure of 100,000 surgeries per year has been adopted by UOAA and appears in a number of current UOAA publications.
From Figure 1, we can also determine the number of temporary ileostomies and colostomies as a percentage of total surgeries. This yields the plot:
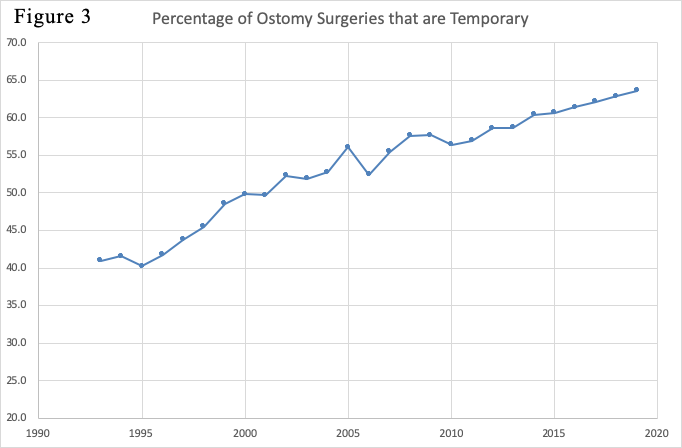
The temporary percentage has been increasing steadily. It’s interesting to recall that when the old UOA shut down in 2005 (before it was replaced by UOAA), one of the justifications UOA offered for closing its doors was: “Medical advances have reduced the number of permanent ostomies. The latest statistics indicate that 40 percent of current surgeries are temporary” (from “End of an Era” by Dean Arnold, UOA’s last President). While I don’t think it justified shutting down the national ostomy organization, it’s certainly true that medical advances have reduced permanent ostomies (sphincter-sparing colorectal surgeries have reduced permanent colostomies; J-pouch surgeries have reduced permanent ileostomies). Meanwhile, Figure 3 shows that, when UOA shut down in 2005, the temporary percentage was already about 55% (which was greater than the 40% figure claimed by UOA). Now, the temporary percentage is about 65%.
Figures 1, 2 and 3 all refer to numbers of surgeries. We also would like to know the size of the ostomy (and continent diversion) populations each year. To determine population sizes we should know, not only the numbers of surgeries each year, but also the durations of each ostomy type, i.e., how long does the ostomy remain in place after it’s created? For “permanent” ostomy types, the ostomy will presumably remain in place for the rest of the person’s life, so the question becomes: how long do people live after creation of their ostomies?
For answering that question, the distribution of ages at which people have each surgery type can be found in the HCUP data. Given those age distributions, I make different assumptions for each ostomy type. For permanent ileostomies, I assume life expectancy to be the same at each age as people in the general population. So I simply combine the age data in HCUP with life expectancy tables for the general population. For the other permanent ostomy types, I assume colostomies have typically been done for colon cancer and urostomies for bladder cancer. Therefore, I reduce the life expectancies for those ostomy types based on mortality data for the respective cancer types. Based on those calculations, I estimate average durations for the permanent ostomy types as:
Permanent ileostomy: 26 years
Permanent colostomy: 13 years
Urostomy: 14 years
Since these are averages, the actual duration of any ostomy may be longer or shorter than these averages. Nevertheless, to a good approximation, we can estimate the ostomy populations at any time by simply assuming that each ostomy remains in place for exactly the number of years indicated by its average duration. For example, we would assume all urostomies remain in place for exactly 14 years, so we can estimate the number of people with a urostomy at any time by simply adding up the number of urostomy surgeries during the past 14 years. (As a specific case, we would estimate the number of people with a urostomy in 2012 by adding up the urostomy surgeries during the 14 years from 1999 to 2012.) Figure 4 shows the results of such calculations for each ostomy type:
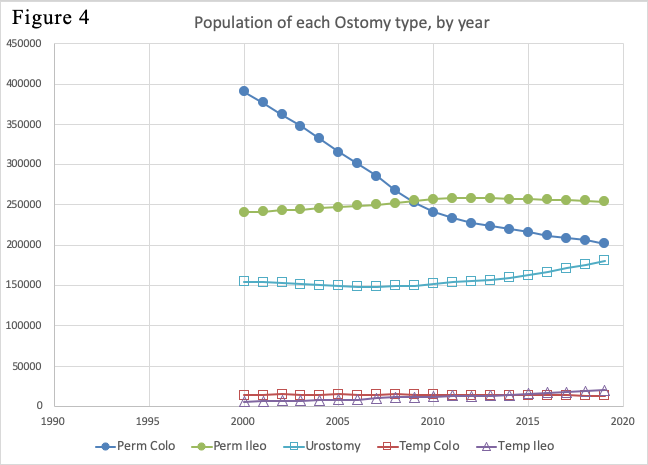
As a subtlety in this calculation, estimating population sizes in some years would require surgery data from early years that I don’t have. For example, estimating the colostomy population in 2002 would require adding up the colostomy surgeries from 1990 to 2002. However, as shown in Figure 1, I don’t have surgery numbers for years earlier than 1993. To resolve that issue, I simply assumed that the number of surgeries in each year before 1993 was the same as found for 1993. Of course, this means that the population estimates in Figure 4 become less accurate for earlier years. To limit that inaccuracy, I don’t display population estimates for any years earlier than 2000.
Figure 4 also displays population estimates for temporary ileostomies and colostomies. For this purpose, I assumed that the temporary ostomies remain in place for only half a year before they’re reversed. With this assumption, the number of people living with a temporary ostomy at any time is just the number of temporary ostomies created during the past 6 months, thus, just half the number of temporary ostomies created per year. The result, shown in Figure 4, is that the population numbers for temporary ostomies are way at the bottom of the chart. Or, in other words, even though temporary ostomies dominate the surgery numbers in Figures 1 and 3, the number of people currently living with a temporary ostomy is tiny compared with the number living with a permanent ostomy.
Note that the curves in Figure 4 are smoother than the original curves in Figure 1. That’s because, mathematically speaking, the process of deriving Figure 4 from Figure 1 is equivalent to a running average operation, which is well known to be a smoothing process. To be more precise, the curves in Figure 4 are not just smoothed versions of the curves in Figure 1, but are also shifted to the right compared with the originals in Figure 1. That’s because, due to the finite durations of each ostomy type, changes in the surgery rates have delayed effects on the population sizes. For example, the sharp drop in colostomy surgery rates from 1995 to 2000, as shown in Figure 1, led to the more gradual decrease of the colostomate population from 2000 to 2010, as shown in Figure 4.
By adding up the numbers in Figure 4 for all the surgery types, we get the following plot for total population size:
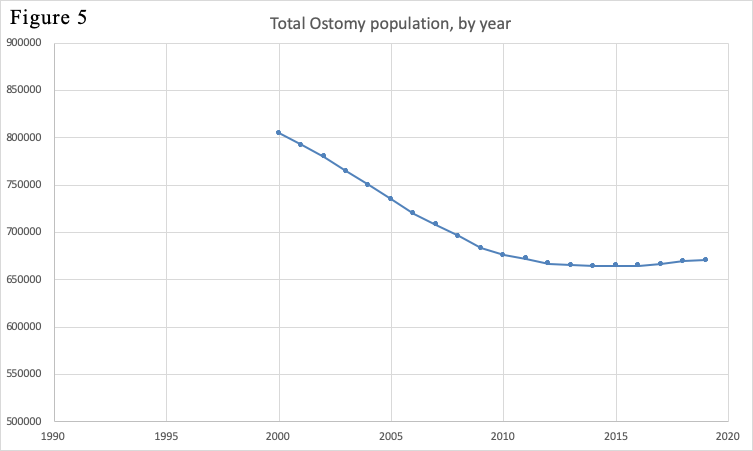
Figure 5 shows that the total ostomate population was decreasing from 2000 to 2010, due mainly to the decreasing number of permanent colostomates. After 2010, the population leveled off and even started increasing at a slow rate. That’s because, although the colostomate population has continued to decrease at a slow rate, that effect has been overtaken by an increase in the urinary diversion population.
From Figure 5, the current population size appears to be about 670,000. This includes some continent diversions (continent ileostomies and continent urinary diversions) but it doesn’t include J-pouches. I estimate that there are at least 30,000 people living with a J-pouch. So I believe the current U.S. population living with an ostomy or continent diversion is at least 700,000. As another observation, the HCUP data used in deriving Figure 1 was based on “discharges from U.S. community hospitals.” This means that it doesn’t include military or VA hospitals, which surely also do a significant number of ostomy surgeries. Accounting for this additional factor, I estimate that, overall, the number of people in the U.S. living with an ostomy or continent diversion is between 700,000 and 750,000.
Current literature from UOAA states that the number of people in the U.S. living with an ostomy or continent diversion is between 725,000 and one million. The low end of that range (725,000) was selected as a representative figure for the results I obtained. The upper end of the range (one million) was based on a totally different data source, namely, some market research data prepared for companies that sell ostomy equipment. I am not in a position to comment on the validity or accuracy of that market research data.
Back in December 2009, the Phoenix magazine included the article “American Ostomy Census” by Colin Cooke which, like my work, was based on HCUP data. Specifically, Colin used HCUP data for the 6 years from 2002 to 2007. From that data, he concluded that the number of people in the U.S. living with an ostomy was about 730,000 and was increasing by 1.5% per year. In some respects, Colin’s results agreed closely with mine. He and I both saw the rapid increase of temporary ileostomy surgeries as shown in Figure 1. Nevertheless, he claimed that the total population of ostomates was growing, while my results in Figure 5 show that it was decreasing at the time of Colin’s study. Due to methodological differences, my numbers differed from Colin’s in some surgery categories. But perhaps the major reason for our opposite results on total population trend was the limited time range of the HCUP data used by Colin (2002 to 2007). Because he didn’t have any surgery data earlier than 2002, he didn’t see the sharp drop of permanent colostomy surgeries that occurred from 1995 to 2000 as shown in Figure 1. If he had been aware of that big drop in colostomy surgeries, which happened just a few years before the beginning of his study period, I think he would have realized that the population of colostomates, and therefore the total population of ostomates, was decreasing at the time of his study.
As noted earlier, I used HCUP data for the years from 1993 to 2014, so the numbers shown in my plots for years after 2014 are mathematical extrapolations. The reason I don’t have actual data after 2014 is that in 2015, the medical industry changed from ICD-9 to ICD-10 procedure codes (specifically, they made that transition on Oct 1, 2015). All surgery inferences in my analysis (as well as Colin Cooke’s earlier analysis) were based on ICD-9 procedure codes which appear in the HCUP data for those years. Some information using ICD-10 codes has begun to appear now in HCUP data for 2016 and later years. However, the ICD-10 codes are very different, breaking surgeries into much smaller steps. It’s questionable whether meaningful ostomy surgery numbers can be derived from the newer data based on ICD-10 codes, and if so, whether they would be comparable with the estimates derived for years before 2015.
Figure 1 shows that temporary ileostomies are the type of ostomy surgery performed most often now. Most of these temporary ileostomies are, in fact, loop ileostomies which are often more difficult to care for than permanent ostomies. Thus, we need to be aware that, even though the patients who get these temporary ileostomies may have them for only a few months, they may need a lot of help during the time they have their temporary ostomy.
In its project to obtain updated ostomy numbers, UOAA intended mainly to determine two numbers: ostomy surgeries per year and number of people living with an ostomy. In my results, Figures 1, 2 and 3 address the first kind of quantity (surgeries per year) while Figures 4 and 5 address the second kind of quantity (number of people living with an ostomy). It’s interesting to realize the very different natures of these two quantities in terms of the roles played by temporary and permanent ostomies. Temporary ostomies dominate the surgeries per year numbers; for example, Figure 3 shows that 65% of current ostomy surgeries are temporary. Meanwhile, Figure 4 shows that permanent ostomies dominate the population of people living with ostomies; temporary ostomies comprise only a tiny fraction of the people living with ostomies at a given time, due to the short length of time that temporary ostomies remain in place.
These concerns can lead to consideration of another population: An awful lot of people have had temporary ostomies which have been reversed. I provide a rough estimate of this population size below:
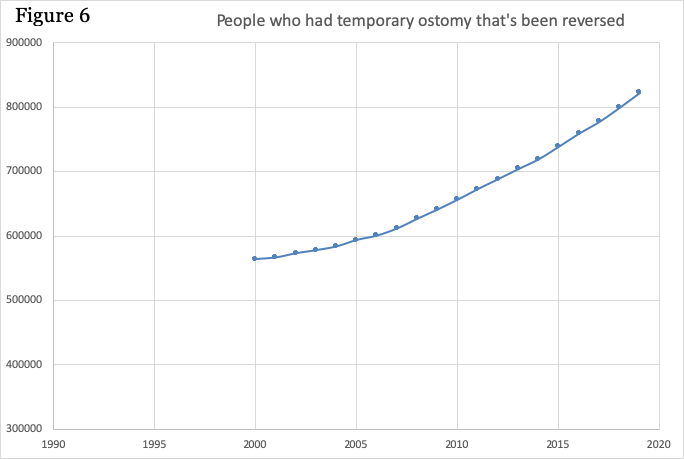
In order to derive Figure 6 from the data in Figure 1, I needed to estimate the average number of years people remain alive after reversal of a temporary ostomy (this is analogous to my previous estimates of ostomy type duration, which I needed for deriving Figure 4 from the data in Figure 1). For this purpose, I’ve made a rough guess that the average remaining lifetime after temporary ostomy reversal is 15 years. Since this is a rough guess, there’s a lot of uncertainty in the actual scale of the numbers in Figure 6. For example, if the average remaining lifetime is just a few years longer than 15 years, the current size of this population would be over a million. In any case, this is definitely a large and rapidly growing population.
The population in Figure 6 includes people with J-pouches as well as numerous people who’ve had temporary ostomies for other reasons such as colorectal cancer surgeries. One thing these people all have in common is that their anatomy isn’t the same as it was before surgery. They’ve all had some portion of their intestines removed. The people with J-pouches have had their whole colon and rectum removed. Those who’ve had cancer surgeries will have had the cancerous portion removed. Many of these people will have continuing bowel problems, where the main factor determining the likelihood of such problems is the amount of their original rectal and anal tissue that’s been removed. Thus, people who’ve had sphincter-sparing surgeries for very low cancers are especially likely to have such problems.
Thus, the population in Figure 6 is a large and growing group of people, many of whom will need continuing help, so we shouldn’t ignore this group.
OstomyOK Home
| What is Ostomy?
| Ostomy Care Guides
| Ostomy Supplies
| Newsletter
UOAA Discussion Board
| UOAA Support Groups
| Contact Webmaster
| Search
| Links